
The impact of NY hospitals on VT's healthcare expenses
VHC911- Stat v.11
UVM Medical Center, Health Network and Vermonters
Why do Vermonters pay more for commercial health insurance than any state in the nation and how can costs be reduced without compromising services? VHC911 analysis demonstrates Vermont has hospitals with extremely high administration & management costs, but that’s only part of the story.
Today we begin to pull back the curtain on the six hospitals that comprise the University of Vermont Health Network (UVMHN or the Network): three in Vermont and three across the lake in New York. Get ready for a data-rich newsletter. The situation is complex, but the takeaways are relatively simple: the New York side of the Network loses money, and the Vermont side makes up the difference.
The Flagship Hospital
Our largest hospital, the University of Vermont Medical Center (UVMMC), is the major driver of healthcare cost escalation in Vermont. Relative to 103 academic medical centers in the nation, UVMMC had the 10th highest operating profit per discharge in 2023.
Every time UVMMC’s leadership defends their high costs they explain how they lose money on Medicaid and Medicare patients and on charity care. They never publicly acknowledge that most Academic Medical Centers break even or profit on Medicare patients. Nor do they appear to have a plan to reduce costs. To date, their strategy has been to turn to commercial insurance payers to cover these losses.
In 2023, UVMMC reported losses from Medicare, Medicaid, uninsured patients, bad debt and charity care of $228,464,317. The same year commercial profits were $801,927,336. What happened to the leftover $573,463,019?
Enter the University of Vermont Health Network
UVMMC is the largest hospital in The Network and the main driver of hospital costs in Vermont. However, when combined, the other 5 Network hospitals double the size of the Network in terms of capacity (beds) and volume of patient discharges. Champlain Valley Physicians Hospital (CVPH) in Plattsburgh, for example, is the second largest hospital in the Network and has a significant impact on the Network’s financial performance.
The net loss of UVM Health Network hospitals in 2023 for Medicare, Medicaid, uninsured, bad debt and charity care was $331,281,774. But when we overlay net income and losses with growth in the Network’s commercial profits (Figure 1), the results show that the loss categories cited by Network leadership were much smaller than the growth in commercial profit. In fact, the Network’s commercial insurance profits in 2023 were $913,585,976, almost three times greater than losses from the other sources combined.
Figure 1. Commercial profits compared with reported losses for UVMHN hospitals.

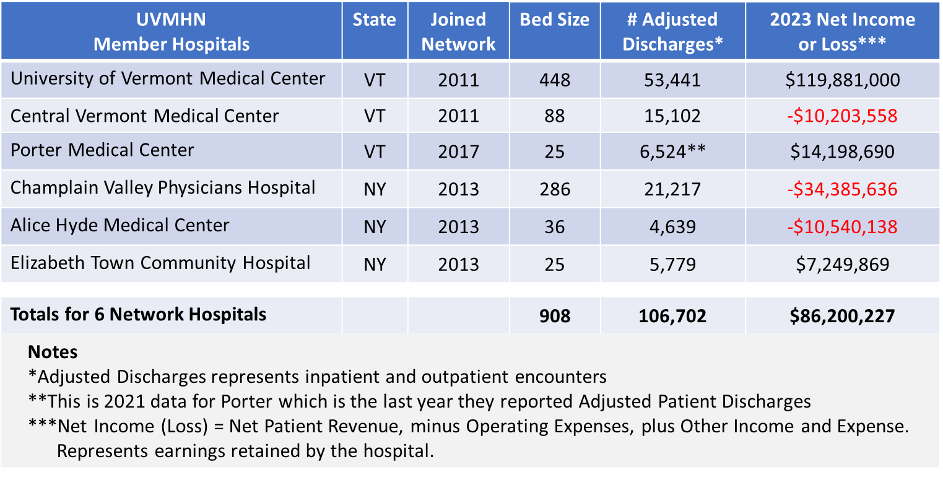
Looking at 2023, it’s clear the Vermont hospitals in the Network are carrying New York financially. That year, three Network hospitals reported a combined net loss of $55,129,332. Two New York hospitals accounted for $44,925,774 of the loss (81.5%). That same year, UVMMC reported a $120 million net gain, offsetting losses elsewhere in the Network (Table 1).
Table 1. Characteristics of hospitals in the UVM Health Network.
And, the multi-year trends shown below shows a similar dynamic (Figure 2).
Figure 2. Net Income (or Loss) for UVM Health Network Hospitals since 2014.
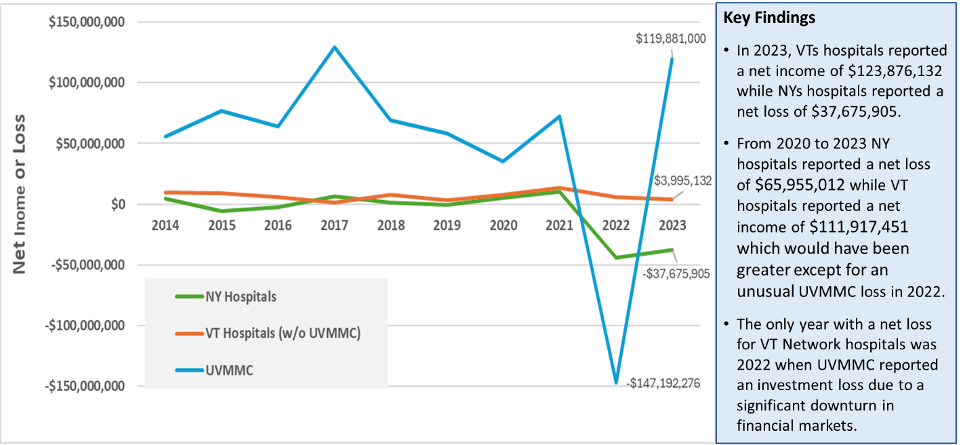
Since 2014, the three NY hospitals had a combined net loss in 5 out of 10 years (2015, 2016, 2019, 2022, 2023), and a cumulative net loss of $62,877,571 over the 10-year period.
The three VT hospitals reported a cumulative net gain of $601,619,867 over the same 10-year period.
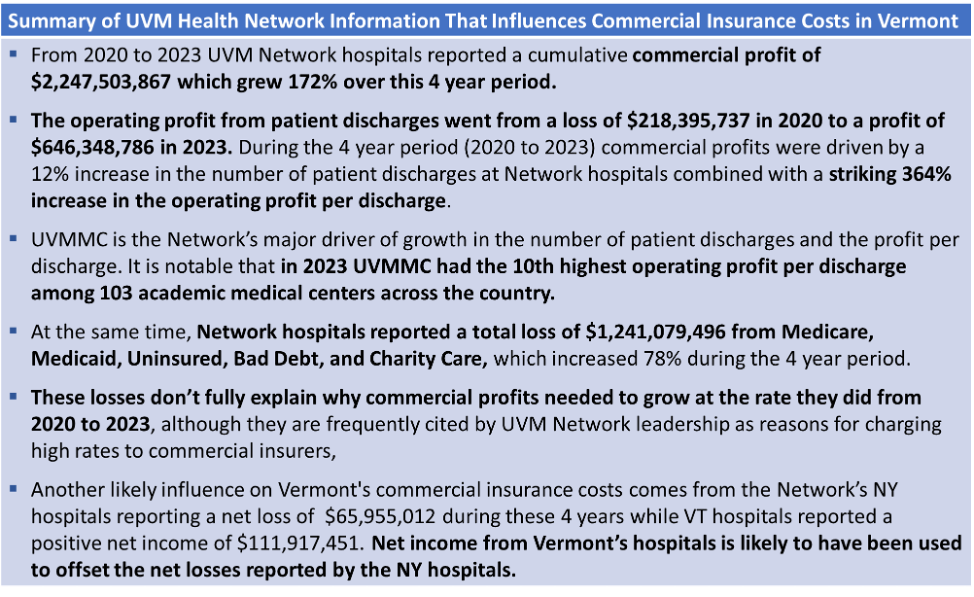
What is driving the growth in UVM Health Network commercial profits if they are not explained by losses on Medicare, Medicaid, uninsured, Bad Debt, and Charity Care? Further review of the data reported by UVM Health Network hospitals (Figure 3) shows that the growth in commercial profits is mostly driven by a substantial increase in Profit Per Discharge and a modest increase in volume (the number of Adjusted Patient Discharges).
Figure 3. Change in profit per discharge and number of discharges at UVM Health Network hospitals.

The results shown in Figure 3 refute UVMHN’s claim that increases in patient volume (utilization) are the primary driver of increased commercial insurance costs. Actually, volume increased at a modest 12% while the operating profits per discharge skyrocketed by 364%.
In the same period, commercial health insurance premiums in Vermont increased from $622 to $944 per month, an increase of 52% (Marketplace Average Benchmark Premiums, 2014-2025 | KFF). Claims paid by BlueCross BlueShield of Vermont increased 17% each year between 2020 and 2023 driving double digit premium increases.
The Picture Comes into Focus
These insights help to explain why commercial insurance costs rose so rapidly from 2020 to 2023. Vermont’s high costs for insurance are a consequence of several factors, including modest increases in number of patient discharges, rapid escalation of the profit per patient discharge, and offsets for hospital losses, particularly those in NY. Lowering the cost for commercial insurance in Vermont will require hospitals to operate more cost effectively, and for UVMMC to make do without having the 10th highest profit per discharge in the country (among 103 academic medical centers).
With UVM Health Network profits of over $2.247 Billion in the last four years, upcoming hospital budgets can and must be significantly reduced without cutting services for patients. Vermont can’t afford to wait any longer for rate relief.
Up Next
VHC911 will examine the important factor of quality while continuing to examine the influence of the UVM Health Network on care delivery, management & administration. The Network was formed with the promise of bringing efficiencies to Vermont and improving the quality of services available to Vermonters. While there are limits due to the data that is available, the coalition will work toward improving public understanding of how the UVM Health Network is impacting our state.
VHC911 believes our hospitals are a vital part of a strong healthcare system. We also believe hospitals must be run efficiently so that most healthcare spending is focused on patients. In a time of deep political division, VHC911 is dedicated to maintaining a broad coalition of business and labor leaders, health care providers, non-profit leaders, educators, policy makers, and political leaders united to demand relief in health care costs and to achieve an affordable health care system.
Data from this analysis comes from NASHP Hospital Cost Tool Data Set, released December 2024.