
Does the UVM Health Network Deliver on the Promise of Value & Efficiencies?
VHC911- Stat v.12
The UVM Health Network was created to “deliver outstanding care cost-effectively” and promised that communities would be better served “focused on collaboration instead of competition” (https://www.uvmhealth.org/about-uvm-health-network). The Network promised economies of scale, efficient administration, and improved quality – have they delivered?
Ten years of UVM Health Network data: financial efficiencies, cost effectiveness and quality – all trending poorly
Figure 1 data shows two distinct phases. While costs have climbed 6% a year, the 2016 – 2020 era showed a steady decline in profits across the Network. This multi-year financial trend of decreasing net operating margin led into 2020 (COVID) when the Network reported an operating loss.
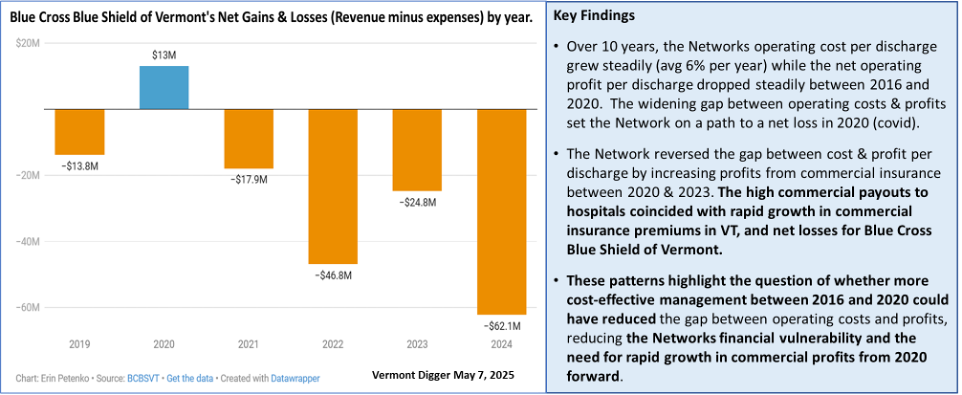
At that point, financial management changed, the trend reversed, and commercial profits increased rapidly between 2021 and 2023. This coincides with BCBS of Vermont reporting increasing losses (see Figure 1b) at the same time Vermonters experienced escalating commercial insurance premiums.
Figure 1a. Impact of UVM Network financial management on commercial insurance in Vermont.

Figure 1b. Blue Cross Blue Shield of Vermont Net Gains & Losses by year.
How do the Network’s Vermont and New York hospitals compare when looking at profit as a percentage of costs (Figure 2)? The results show that VT hospitals consistently outperformed NY hospitals, and that NY hospitals continued to have a net operating deficit in 2022 and 2023 even as VT's hospitals reported net gains.
These results reinforce the finding that over a 10-year period the UVM Network was not able to bring more balanced performance across the Networks hospitals, and that Vermonters purchasing commercial insurance are likely to be subsidizing operations at NY hospitals.
Further, it’s worth noting that the growth in commercial profits was primarily driven by UVMMC and not at the Network level so after a decade, management has not effectively reformed individual hospital performance. Instead, they seem content to rely on a Network-wide balance sheet.
Figure 2. Comparison of financial performance between Network hospitals in VT & NY.

Is the network delivering on Administrative & Management efficiencies?
No. Ten years of data shows that the Network has steadily become top heavy with Management and Administration (M&A). Labor patterns observed at the Network level mirror the patterns that VHC911 has previously reported for the UVM Medical Center (UVMMC), namely a steady trend increasing labor devoted to M&A while decreasing the proportion of labor that is devoted to patient care (Figure 3).
Figure 3. Labor devoted to management vs patient care at the UVM Health Network largest hospitals.

Note: complete labor data was only available for the UVM Health Network’s 4 largest hospitals.
Network leadership have consistently said sharing services such as medical records systems, supplies, and key administrative functions would result in more cost-effective management & administration across Network hospitals. The 10-year snapshot suggests a different outcome with the number of Management and Administration full time equivalent staff (FTEs) growing by 32% while the number of Patient Care FTEs grew only 12% across the Networks 4 largest hospitals. This 32% growth in Management and Administration is observed at 3 of the 4 hospitals; Central Vermont Medical Center showed a modest 3% reduction. If the Network was delivering on promised efficiencies the number of FTEs devoted to Management and Administration (M&A) should have declined. It is also noteworthy that the pattern of emphasizing staffing devoted to M&A over Direct Patient Care has coincided with long wait times for Vermonters to access care at UVMMC. The 10-year pattern suggests that Network leadership has extended an M&A oriented business culture across Network hospitals instead of delivering management or cost efficiencies.
What about quality?
One of the Network’s potential advantages is the ability to more effectively disseminate consistent quality improvement & monitoring strategies across participating hospitals. One available source of quality data comes from the Leapfrog Group. This non-profit organization has focused on transparency in healthcare for over 20 years and reports a Hospital Safety Grade for more than 3000 hospitals semi- annually (Hospital Ratings and Reports | Leapfrog). A key composite measure is the Hospital Safety Grade which focuses on how hospitals protect their patients from errors, injuries, accidents, and infections, using national performance measures from the Centers for Medicare & Medicaid Services (CMS). The measure results are used to produce a single letter grade (A through F) representing a hospital’s overall performance with methodology that has been peer reviewed and published in the Journal of Patient Safety. Safety grades from 2022 through spring of 2025 are shown below for hospitals serving Vermonters. The largest letter on the left represents the spring 2025 grade.
Figure 4. Leapfrog safety grades for hospitals serving Vermonters.

Several points stand out from the Leapfrog hospital safety ratings:
UVM Network hospitals score lower than other hospitals serving Vermonters with no UVM Health Network hospital having higher than a D rating in the most recent rating (Spring 2025).
Between 2022 and 2025 the UVM Network’s largest hospitals have been trending downward on safety ratings. UVMMC and CVMC had B ratings in 2022 that sunk to D and F ratings respectively, while CVPH in NY has declined from C to a D rating.
There are mixed trends for the non-Network hospitals including three that improved from 2024 to 2025 (Albany, Northwestern, Southwestern) and 2 that declined (Dartmouth, Brattleboro).
As a state, VT’s hospital safety ratings rank 48th in the country with no Vermont hospitals having an A rating (State Rankings). Surrounding states rank higher: NH ranked 23rd, ME ranked 18th, MA ranked 28th, and NY ranked 31st.
The results from Leapfrog indicate that the UVM Network’s centralized operations have not improved patient safety across their member hospitals. Detailed results for VTs hospitals including UVM Network hospitals are available here. It is important to note that UVMMC, CVMC, and CVPH do not participate in Leapfrog’s voluntary survey, however Leapfrogs methodology allows them to be scored using CMS data and other sources as long as sufficient data is available. It should also be noted that other hospitals in VT such as Southwestern Vermont Medical Center do not participate in the voluntary survey yet they were able to achieve a B rating on the hospital safety ranking. Smaller Critical Access Hospitals are not included in the Leapfrog rankings which is why the UVM Networks smaller hospitals are not included in this report (Porter, Elizabeth Town, Alice Hyde).
There are other sources of quality data that we will explore further, but the troubling Leapfrog trend is backed up by a revelation in the Green Mountain Care Board’s FY25 budget order. UVMMC had fines assessed by CMS due to quality and safety issues, specifically the level of hospital acquired conditions (HAC) experienced by UVMMC patients around 2021-2022. CMS issues these types of fines for hospitals that perform in the bottom 25% and can result in a 1% reduction in payments.
Overall, the results reported in this newsletter point to declining value in terms of cost, top heavy administration, and quality. This is especially concerning as Vermont’s citizens are paying extraordinarily high rates for commercial insurance. The results continue to show better performance from non-network hospitals that serve Vermonters, particularly when it comes to cost effective operations that don’t result in such high commercial profits. Assessing value is complex and the VHC911 Coalition is committed to providing Vermont’s citizens with the best information available, so we will continue to explore value and use additional data sources particularly to examine the broader topic of healthcare quality.
VHC911 believes our hospitals are a vital part of a strong healthcare system, and we know that UVM Health Network hospitals have incredibly talented and dedicated people delivering care. The results show that UVM Health Network operations could be run more cost effectively, and we believe this is essential so that a greater proportion of spending is focused on caring for patients and less is spent on redundant layers of Management & Administration. The UVM Health Network has entered into an agreement with the Green Mountain Care Board that regulates hospital budgets, and Network leadership have told us that they are actively working on plans to reduce costs and improve efficiencies including reducing their layers of management & administration. This is a promising development; yet actions and communications to date do not reflect the sense of urgency that is required or depth of change in management culture that is needed.
In a time of deep political division, VHC911 is dedicated to maintaining a broad coalition of business and labor leaders, health care providers, non-profit leaders, educators, policy makers, and political leaders united to demand relief in health care costs and to achieve an affordable health care system.
Data from this analysis comes from NASHP Hospital Cost Tool Data Set, released December 2024.